Technology
SedLine®
Brain Function Monitoring
A More Complete Picture Starts with More Complete Data
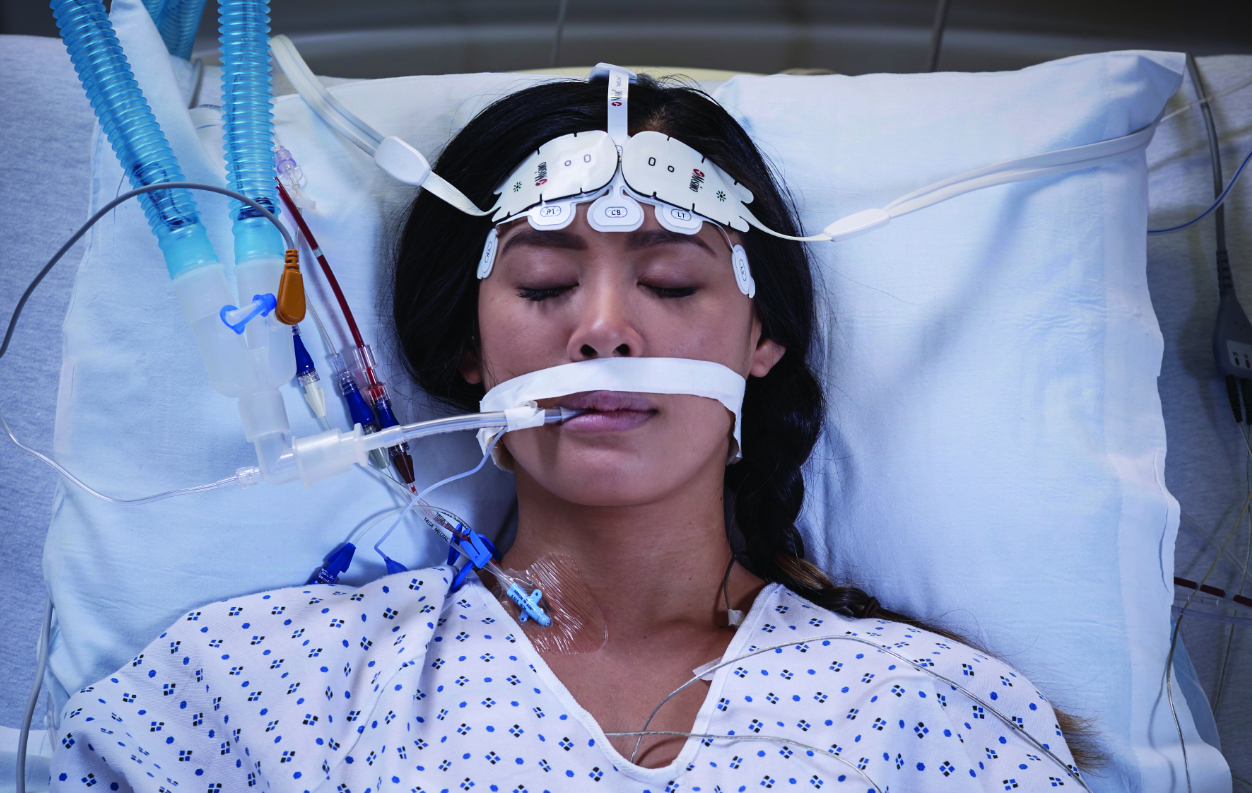
Brain Function Monitoring helps clinicians monitor the state of the brain under anesthesia with bilateral data acquisition and processing of electroencephalogram (EEG) signals.
Deliver Anesthesia Based on Individual Patient Need
Identify Incidences of Burst Suppression
Gain a More Complete Picture of Patient Sedation
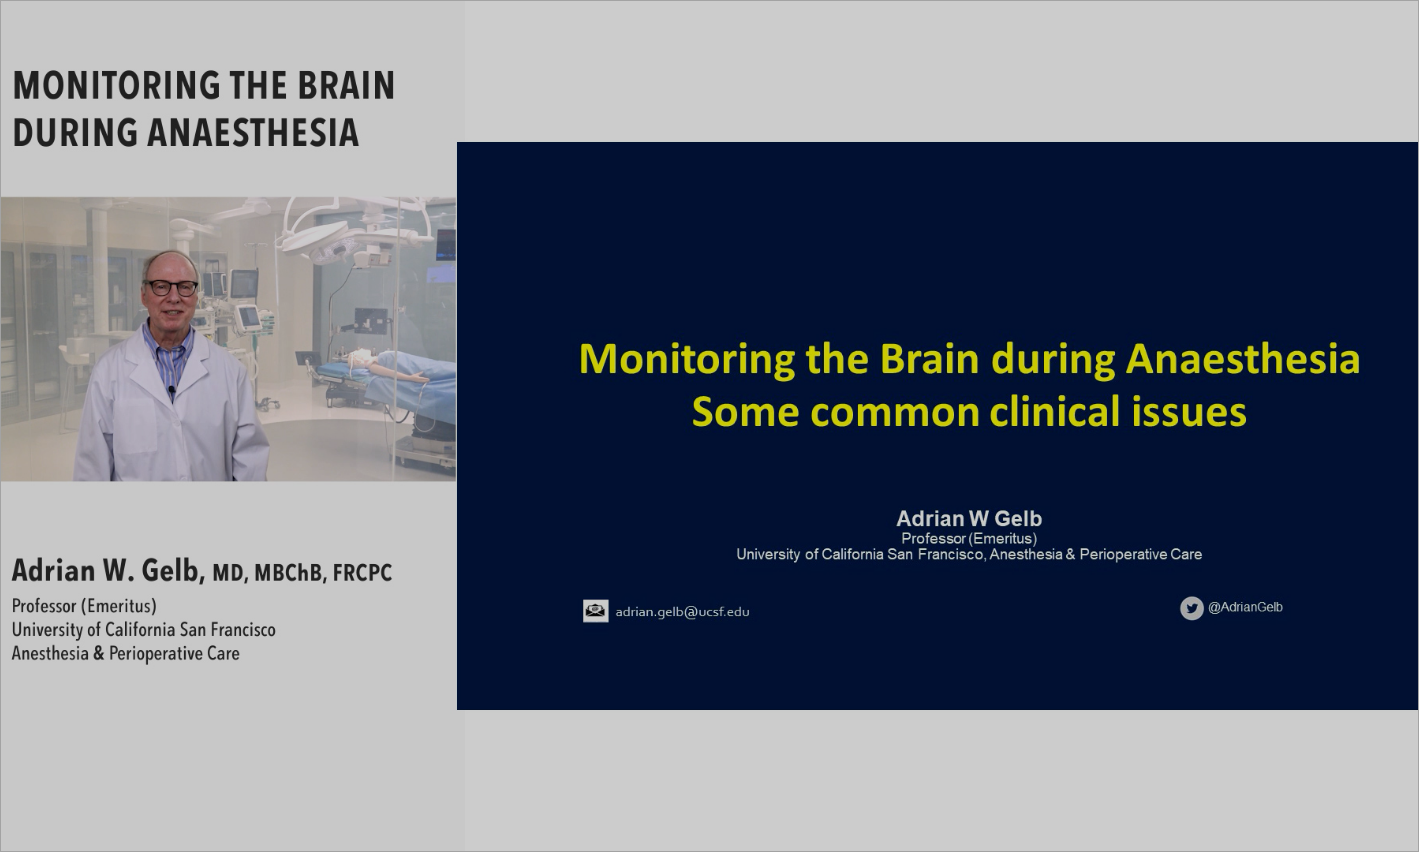
Why Monitor the Brain During Anesthesia?
The brain is one of the most important organs in the body. By delivering greater insights into changes in brain function under anesthesia, SedLine is designed to help monitor it before, during, and after surgery.
Deliver Balanced Anesthesia
Titrating to the individual patient’s needs may help reduce oversedation,1 which has been linked to poor outcomes.2
-
Clinical Evidence
Clinical Benefits of Processed Electroencephalography (pEEG)
Patients may experience:
- Less burst suppression1
- Less over-sedation1
- Enhanced recovery and more rapid ventilation weaning3
Clinicians and hospitals indicate they benefit when technology impacts:
- Reduced length of stay (LOS)3
- Reduced cost per patient3
-
Clinical Evidence
EEG Patterns Associated with PACU Delirium2
“Specific EEG patterns were associated with PACU delirium. These findings provide valuable information regarding how the brain reacts to surgery and anaesthesia that may lead to strategies to predict PACU delirium and identify key areas of investigation for its prevention.”2
Improve Pediatric Anesthesia
SedLine has been shown to help make pediatric anesthesia safer, more efficient, and more cost effective.4
-
CLINICAL EVIDENCE
Reducing Pediatric Anesthesia Emergence Delirium (PAED)
Guiding pediatric anesthesia with Masimo SedLine processed EEG has been shown to significantly improve the administration of anesthesia in children undergoing surgery.
In a randomized clinical trial of more than 170 children aged 1 to 6 years, children monitored with SedLine:
- Were exposed to an average of 1.4 MAC hours less sevoflurane (a common inhaled anesthetic) and had a 14% lower incidence rate of PAED.
- Regained consciousness 53% sooner and were discharged from the PACU 48% sooner -- which saved an estimated $240 to $920 per patient.4
Dean Kurth, MD, attending anesthesiologist at Children’s Hospital of Philadelphia, noted that this study "confirms the growing realization by pediatric anesthesiologists worldwide that more anesthesia drug is being administered to children than necessary, which has negative consequences. As the authors have shown, SedLine EEG data can help clinicians provide more precise anesthetic drug dosing for each child and improves outcomes.”
"...reasons why monitoring processed EEG may be of value: prevent awareness, save money by reducing anesthetic cost, prevent excessively deep and unnecessarily deep anesthesia..."
- Adrian Gelb, MD
Professor of Anesthesia, UCSF
Past President of WFSA (World Federation of Societies of Anaesthesiologists)
Clinical Testimonies - The Value of Brain Monitoring in OR and ICU
Debunking Misconceptions About Brain Monitoring
The clinical value of monitoring depth of sedation in the operating room. Featuring Dr. Adrian Gelb (UCSF).
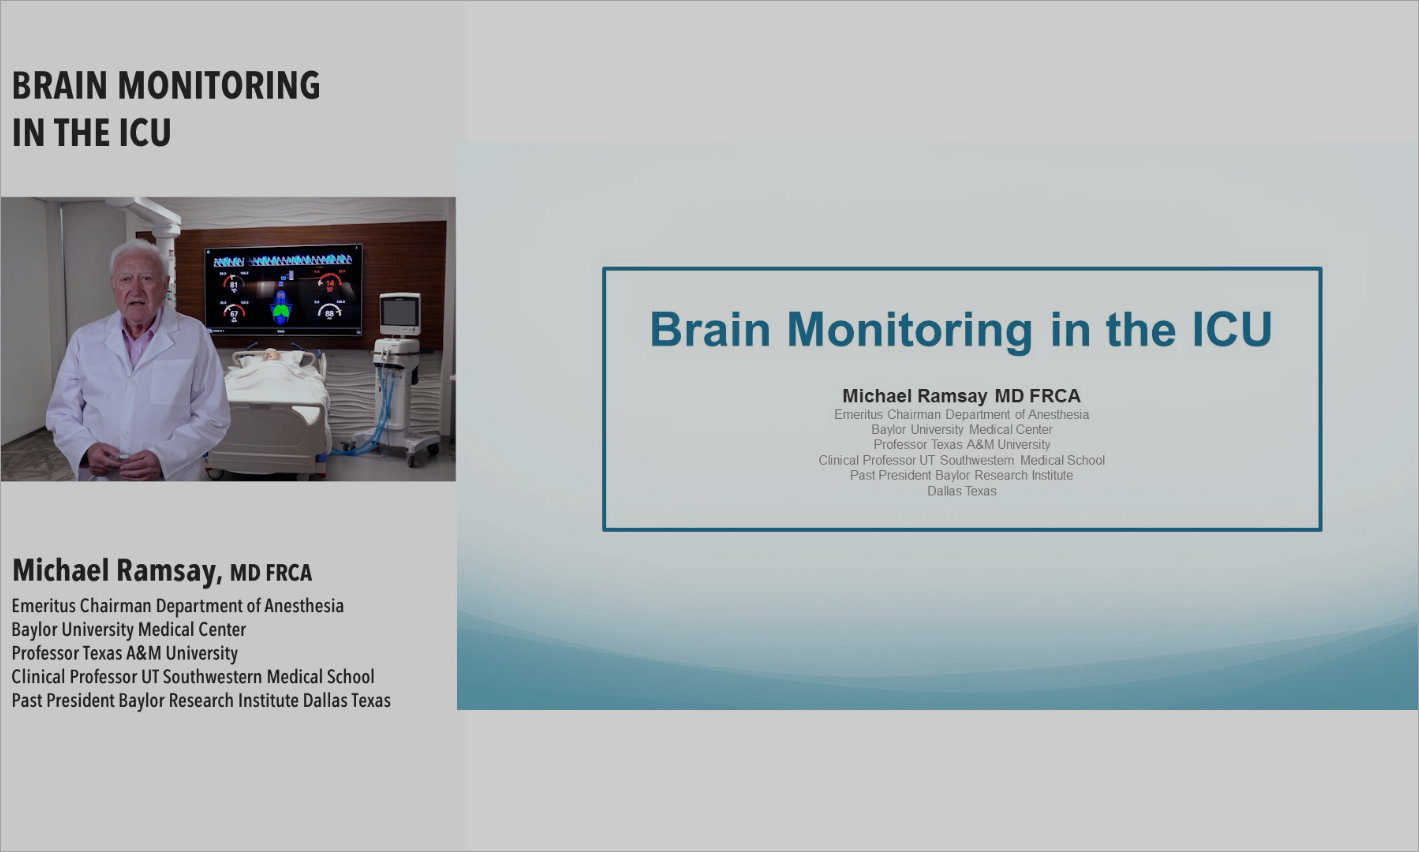
Make Sedation Monitoring a Standard of Care in the ICU
Learn how brain function monitoring in the ICU can support clinicians in making timely, cost-effective care decisions when they matter most. Featuring Dr. Michael Ramsay (Baylor Scott & White).
A More Complete Picture Starts with More Complete Data
See more with SedLine
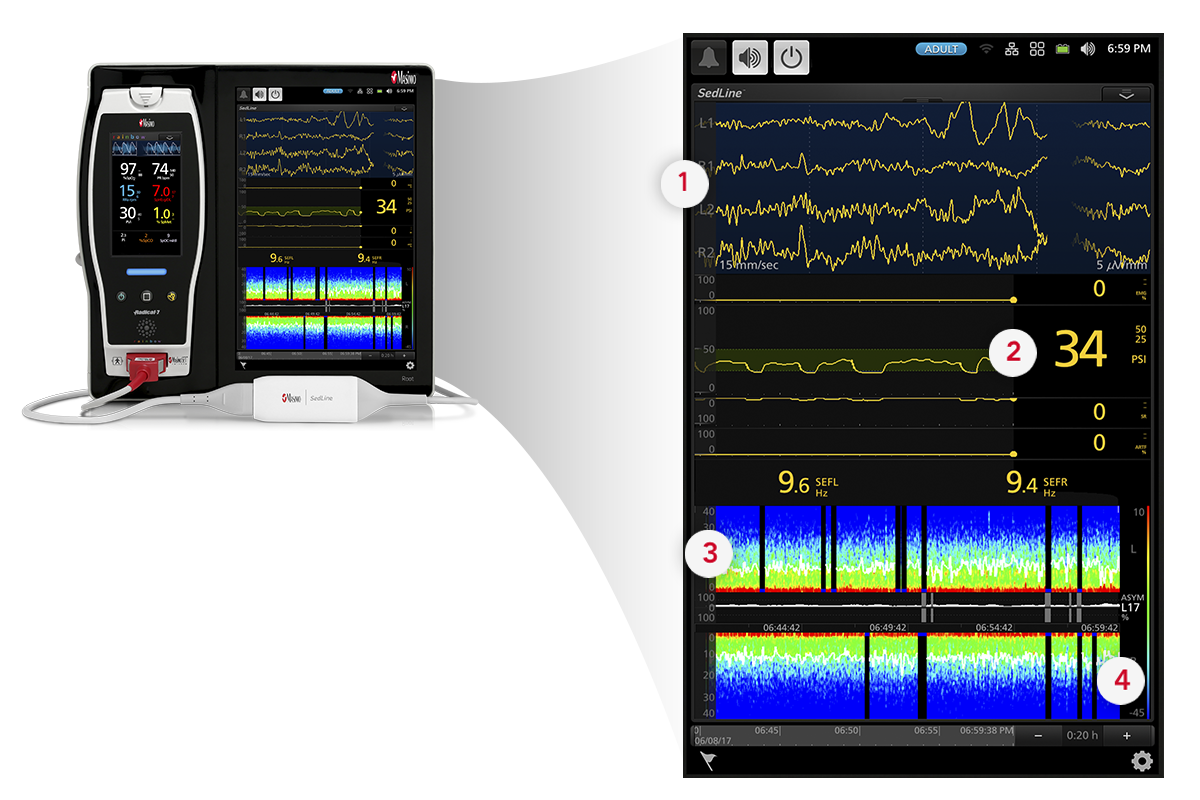
- Four simultaneous channels of frontal EEG waveforms
- An enhanced Patient State Index (PSi), a processed EEG parameter related to the effect of anesthetic agents
- A Density Spectral Array (DSA) display, which contains left and right spectrograms representing the power of the EEG on both sides of the brain
- An optional Multitaper DSA, which may enhance visibility of EEG features
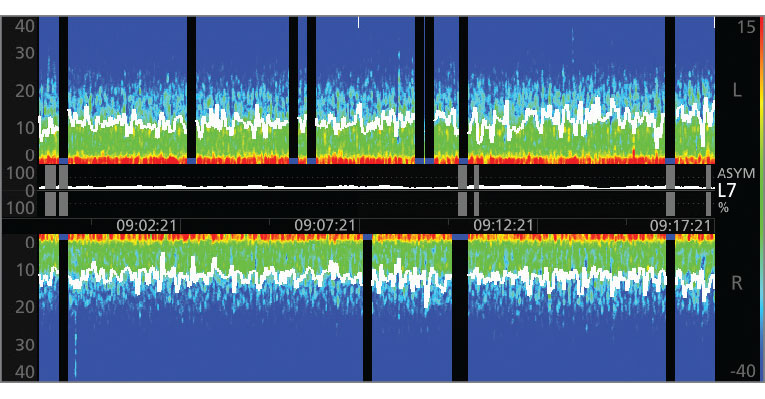
The Power of the Density Spectral Array (DSA)
SedLine offers the flexibility of choosing to display either an enhanced Multitaper Density Spectral Array (DSA) or a standard Hanning DSA.
- This provides the ability to see the symmetry of left and right sides of the brain.
- Clearly indicates incidence of burst suppression/isoelectric activity as a black line with blue tip.
- Spectral edge frequency represents where 95% of the brain power lies.
Understand the DSA
The DSA represents the power of the EEG on both sides of the brain, alongside other patient information provided by SedLine sensors. Watch the video to learn more.
Improved Depth of Sedation Monitoring with Patient State Index (PSi)
SedLine features an enhanced signal processing engine providing a better, more accurate Patient State Index (PSi), a processed EEG parameter related to the effect of anesthetic agents. Learn how we’ve advanced this technology.
-
Enhanced Features
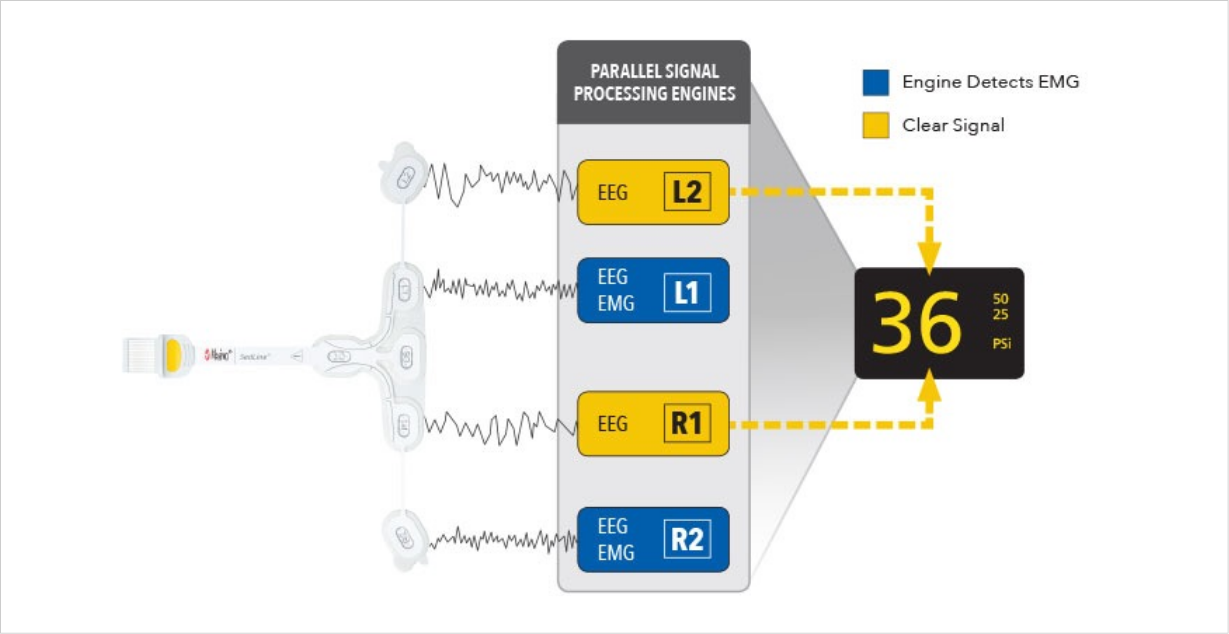
Parallel Signal Processing Engines
EMG is a common confounding factor that can interfere with EEG signals used in brain function monitoring.5 SedLine uses parallel signal processing engines to extract a clearer EEG signal for computing PSi.
-
Enhanced Features
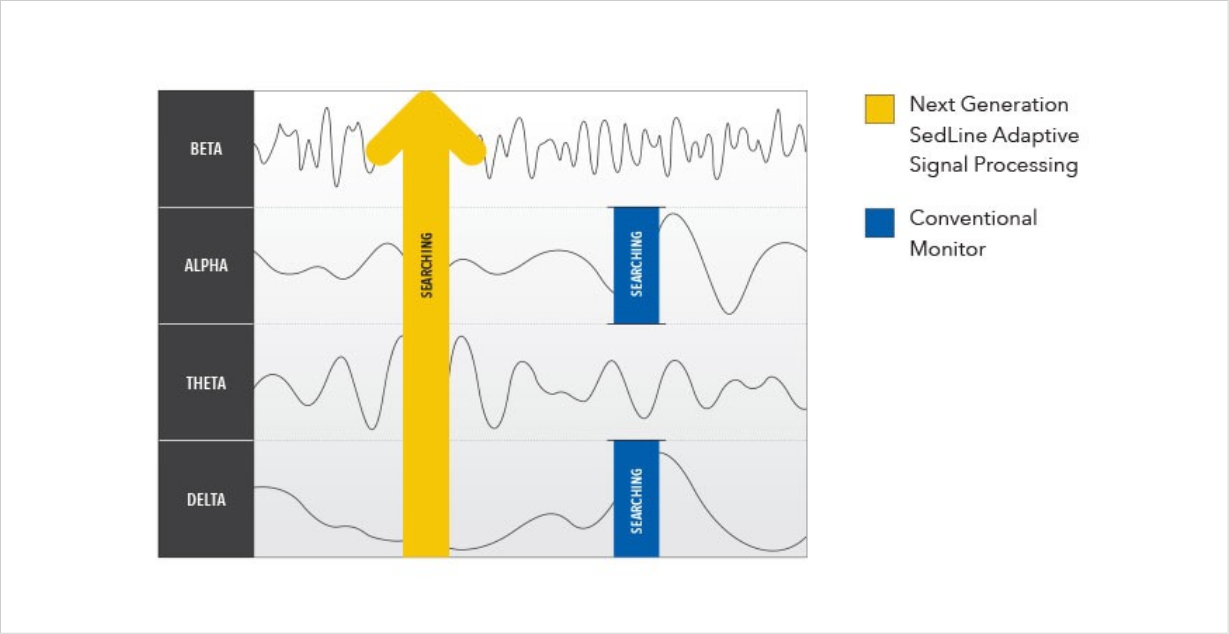
Adaptive Signal Processing
Power across all frequency bands decreases with age.6 When computing PSi, SedLine uses adaptive signal processing with band-independent features to search for EEG features across many frequency bands.
Total Brain Solution via a Multimodal Platform
Expand visibility in the OR and ICU
Identify changes in brain function and make assessments that may help improve patient outcomes.
O3® Regional Oximetry
Next Generation SedLine can be used simultaneously with O3 Regional Oximetry on the Root platform—delivering a more complete picture of the brain.
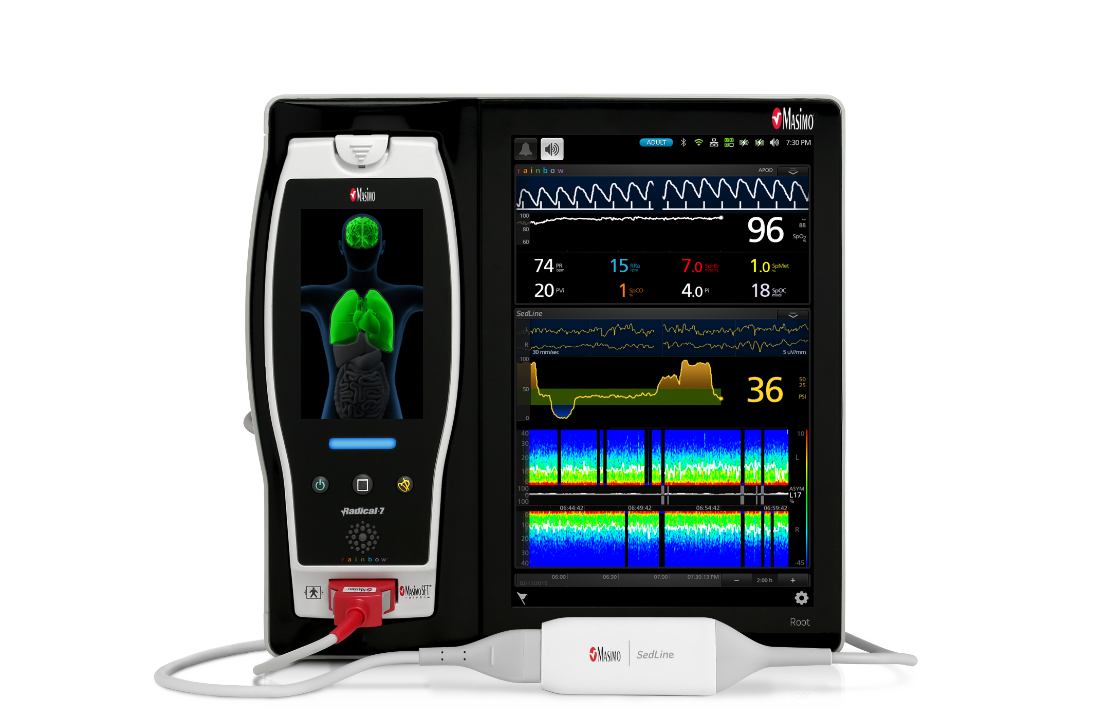
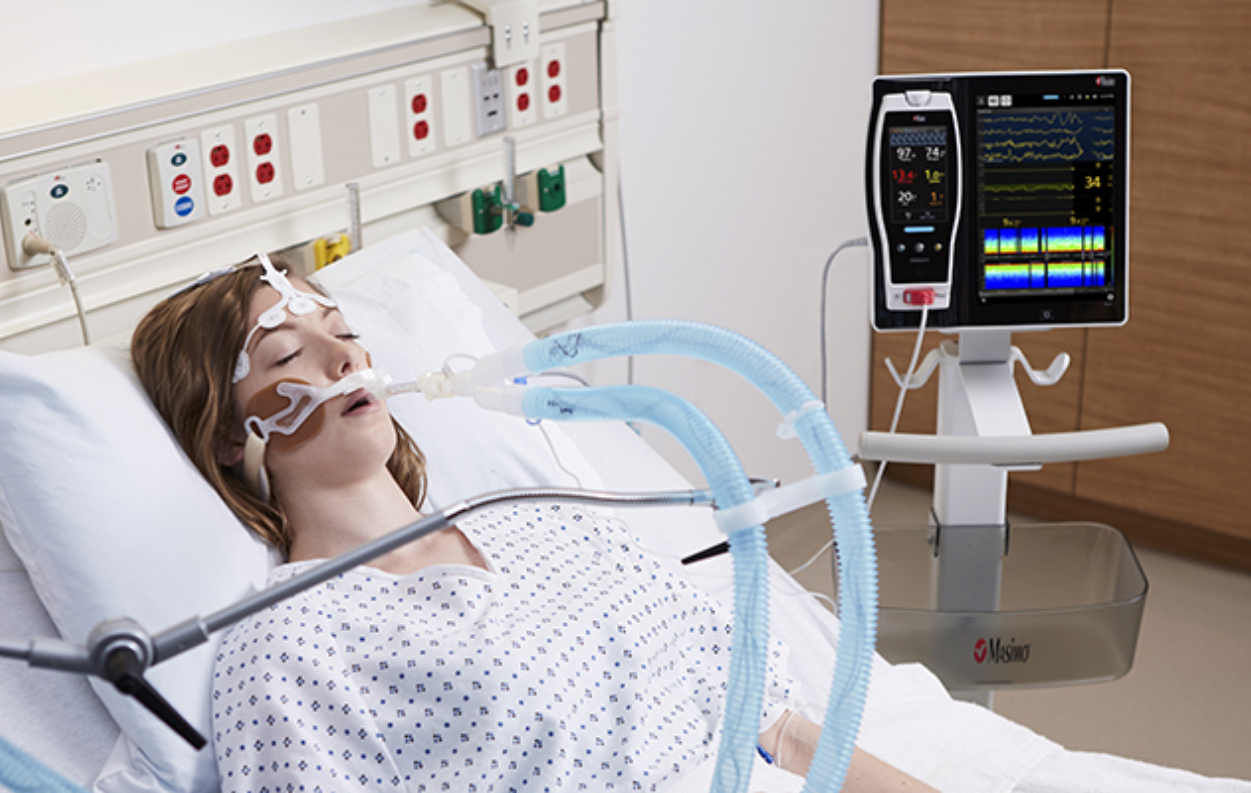
Root® Patient Monitoring and Connectivity Platform
SedLine connects seamlessly to the Root Patient Monitoring and Connectivity Platform—featuring a customizable, easy-to-interpret display that provides multiple views of brain monitoring data for expanded visibility in the OR and ICU.
An integrated perioperative monitoring solution on Root
Via Root, SedLine can be used simultaneously with O3 Regional Oximetry, Total Hemoglobin (SpHb®), and the Masimo LiDCO® Hemodynamic Monitoring System.
- O3 Regional Oximetry
- Total Hemoglobin (SpHb)
- Masimo LiDCO Hemodynamic Monitoring System
Resources
Click below for links to critical information about SedLine Brain Function Monitoring.
Materials
Clinical Cases
Schedule an Evaluation
SedLine is simple and easy to try in your facility and requires minimal additional equipment.
Schedule an Evaluation
Try SedLine in your facility today. Contact your Masimo Representative or complete the form below.
References
Bloom J et al. Anesthesiology Research and Practice. Vol. 2020, pp. 1-6. https://doi.org/10.1155/2020/7246570.
Hesse S et al. Br J Anaesth. 2019;122(5):622-634.
Sayed E et al. J Anesth Clin Res.2015;630(6):5. DOI: 10.4172/2155-6148.1000530.
Lobo, Francisco A., and Stefan Schraag. Limitations of anaesthesia depth monitoring. Current Opinion in Anesthesiology. 24, no. 6 (2011): 657-664.
Purdon P et al. Brit J of Anaesth. 10.1093 46-57.
For professional use. See instructions for use for full prescribing information, including indications, contraindications, warnings, and precautions.
PLCO-007906/PLM-10080H-1025